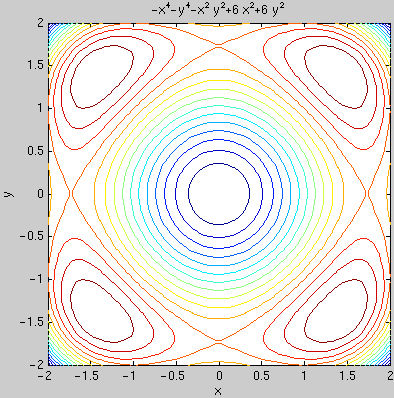
figure(1); ezsurf(f,[-2,2,-2,2]) figure(2); ezcontourc(f,[-2,2,-2,2],15); axis equal; axis tight

You need to download the file ezcontourc.m.
The m-file extrema_ex.m contains
the complete code which computes D and fxx for all critical points, and plots
the critical points.
Example: Find all relative maxima and minima of f(x,y) = -x4 - y4 - x2y2 + 6x2 + 6y2
Define the symbolic variables and f
syms x y
f = -x^4 - y^4 - x^2*y^2 + 6*x^2 + 6*y^2
Find the partial derivatives
fx = diff(f,x)
fy = diff(f,y)
Find critical points (xc,yc) by solving fx=0 and
fy=0 for x and y
[xc,yc] = solve(fx,fy,x,y); [xc,yc]
Matlab finds 7 solutions. The first solution is
xc(1),yc(1),..., the 7th solution is xc(7),yc(7).
Actually, there are 9 solutions and Matlab misses two of them (which?).
Find the second partials and the discriminant D
fxx = diff(fx,x); fxy = diff(fx,y); fyy = diff(fy,y)
D = fxx*fyy - fxy^2
Evaluate D at the first critical point (0,0) by substituting
for x and y the values xc(1) and
yc(1)
subs(D,{x,y},{xc(1),yc(1)})
subs(fxx,{x,y},{xc(1),yc(1)})
Note that we have D > 0 and fxx > 0, hence
this is a relative minimum.
We can similarly check the other six critical points and find that four of them are saddle points, two are relative maxima.
Plot the function as a surface and as contours
figure(1); ezsurf(f,[-2,2,-2,2])
figure(2); ezcontourc(f,[-2,2,-2,2],15); axis equal; axis tight
Can you see all nine critical points?