From a signal-to-noise perspective, the stock market is
an interesting example. A national or global stock market is an
aggregation of large numbers of buyers and sellers of shares in
publicly traded companies. They are described by stock market indexes, which are
computed as the weighted average of a large number of selected
stocks. For example, the S&P
500 index is computed from the stock valuations of 500
large US companies. Millions of individuals and organizations
participate in the buying and selling of stocks on a daily
basis, so the S&P 500 index is a prototypical "big data"
conglomerate, reflecting the overall value of 500 of the largest
companies in the largest stock market on earth. Individual
stocks can fail or fall drastically in value, but the market
indexes average out the performance of hundreds of companies.
A plots of the daily value, V, of the S&P 500 index vs time,
T, for the 75-year period from 1950 through 2024 are shown in
the following graphs.
Each plot contains 75 data points, one for
each year, shown in red. The graph on the left plots the value V
on linear coordinates and the graph on the right plots the natural
logarithm of V, ln(V). There are considerable up-and-down
fluctuations in the value over time that can be related to
historical events: the oil crisis of the 1970s, the tech boom
and bust of 2000, the subprime mortgage crisis of 2008, the
trade wars of 2019, and the Coronavirus pandemic of 2020. Still,
the long-term trend of the value is upwards – by 2024
the value was over 270 times greater than its value in
1950. This is basically why people invest in the stock
market, because on average, over the long run, average stock
values go up, usually faster than inflation (which has been
about 3.5% per year since 1950).
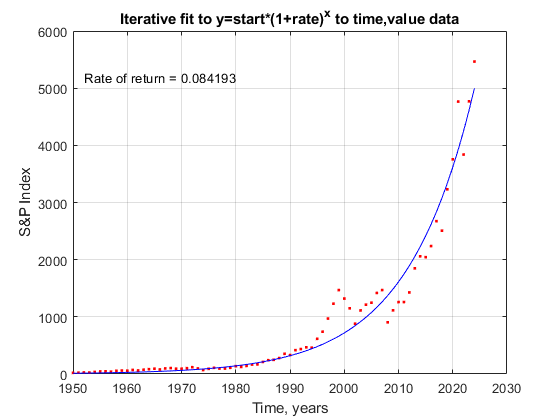
The most common way to model this overall long-term increase over time is based on the equation for compound interest that predicts the growth of investments that have a constant rate of return, such as savings accounts or certificates of deposit:
V = S*(1 + R)T
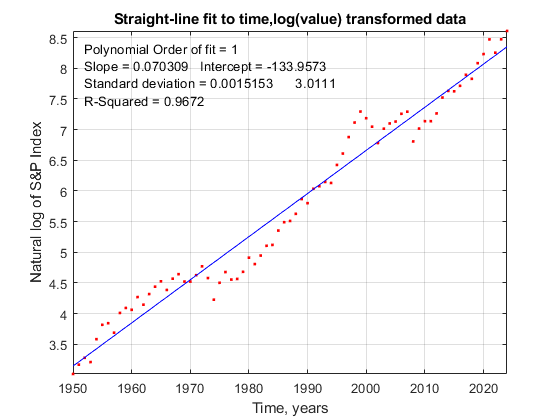
where V is the value, S is the starting value, R is the annual rate of return, and T is time. By itself, this expression would yield a smooth curve, without all the peaks and dips. The values of S and R that result in the best fit to the stock market data (shown by the blue lines in the graphs) can be determined in two ways:
(1) directly, using the iterative curve fitting method, shown on the left above, or
(2) by taking the logarithm of the values and fitting a straight line to the transformed data, shown on the right above.
FitSandPto2024.m
is a Matlab/Octave script that performs both of these
calculations using the data in SandPfrom1950.mat or in SandPfrom1950.xlsx.
When applied to the S&P 500 index data, the rate of return R is about 0.08 (or 8%), but
interestingly these two methods give slightly different results, even
though the exact same data
are used for both, and even though both methods yield the same 8% rate if applied to noiseless synthetic
data calculated from this
expression. How can this be? This difference between methods is
caused by the irregularities in the stock data that deviate from
a smooth line - in other words, the noise - and it is
exacerbated by the large range of the value data V over time and
by the fact that the average return from 1950 to
1987 is lower than that from 1987 to 2024.
You might be wondering how good those data are at
predicting the stock market trends. Over the short term, such
predictions are often not very accurate. For example, the trend
line (blue line) in the left-hand plot predicts that the value
of the S&P in 2024 should be 5000. In fact, in July 2024,
the S&P value
was at an all-time high near 5600, or about 12% higher than the
prediction. This, however, is not out of the ordinary; over the
past 75 years, individual values often have fallen at least that
far above (or below) the best-fit line.
From the point of view of curve fitting, the deviations from a
smooth curve described by the compound interest expression is
just noise.
But from the point of view of the stock market investor, those
deviations can be an opportunity and a warning. Naturally, most investors would like to know how the
stock market will behave in the future, but that requires
extrapolation beyond the range of the available data, which is
always uncertain and dangerous. But still, it's most likely (but not
certain) that the long term behavior of the market (say, over a period of 10 years
or more) will be similar to the past - that is, growing
exponentially at about the same rate as before but with
unpredictable fluctuations similar to what has occurred in the
past.
We can take a closer look at those fluctuations by
inspecting the residuals
- that is, subtracting the fitted
curve from the raw data, as shown in iSignal
on the left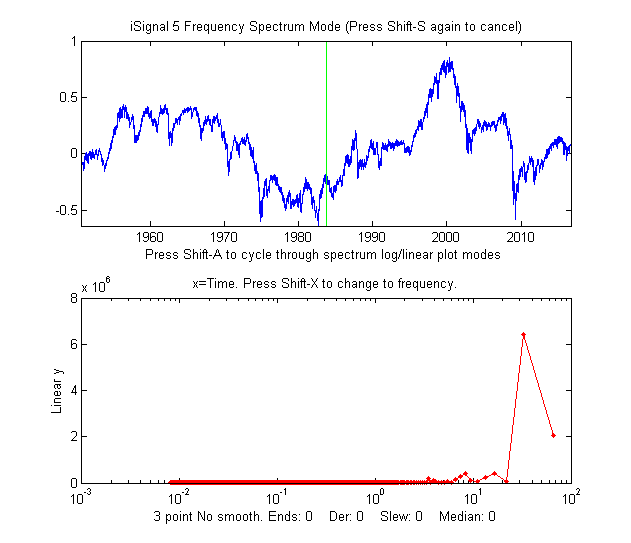 .
There are several notable features of this "noise". First, the deviations
are roughly proportional to V and thus relatively equal
when plotted on a log scale. Second, the noise has a distinctly
low-frequency character;
the periodogram
(lower panel, in red) shows peaks at 33, 16, 8, and 4 years.
There are also, notably, numerous instances over the years when
there is a sharp dip followed by a slower recovery close to the
previous value. And conversely, every peak is eventually
followed by a dip. The conventional advice in investing is to
"buy low" (on the dips) and "sell high" (on the peaks). But of
course the problem is that you can not reliably determine in
advance exactly where the peaks and dips will fall; you
have only the past to guide you. Still, if the current market
value is much higher than the long-term trend, it will likely fall, and if
the market value is much lower than the long-term trend, it will likely rise,
eventually. The only thing you can be sure of is that, in the
long run, the market will rise. This is why saving for
retirement by investing in the stock market, and starting as soon as possible, is so important: over a 30-year working life, the
market is almost guaranteed to rise substantially. The most
painless way to do this is with your employer's 401k or 403b
automatic payroll withdrawal plan. You can not actually invest
in the stock market as a whole, but you can invest in index mutual funds or exchange
traded funds (ETFs), which are collections of stocks that
are constructed to match or track the components of a market index. Such funds
typically have very low management fees, an important factor
in selecting an investment. Other mutual funds attempt to
"beat the market" by carefully buying and selling stocks in an
attempt to create a return that is greater than the overall
market indexes; some are temporarily successful in
doing that, but they charge higher management fees. Mutual
finds and ETFs are much less risky investments than individual
stocks. "Day traders",
investors who buy and sell stocks and other securities
multiple times over a single day, often do not perform well,
because the market is propelled in the long run by business
cycles, new businesses, and new technologies that do not
change over a single day. Minute-to-minute changes are
mostly noise.
.
There are several notable features of this "noise". First, the deviations
are roughly proportional to V and thus relatively equal
when plotted on a log scale. Second, the noise has a distinctly
low-frequency character;
the periodogram
(lower panel, in red) shows peaks at 33, 16, 8, and 4 years.
There are also, notably, numerous instances over the years when
there is a sharp dip followed by a slower recovery close to the
previous value. And conversely, every peak is eventually
followed by a dip. The conventional advice in investing is to
"buy low" (on the dips) and "sell high" (on the peaks). But of
course the problem is that you can not reliably determine in
advance exactly where the peaks and dips will fall; you
have only the past to guide you. Still, if the current market
value is much higher than the long-term trend, it will likely fall, and if
the market value is much lower than the long-term trend, it will likely rise,
eventually. The only thing you can be sure of is that, in the
long run, the market will rise. This is why saving for
retirement by investing in the stock market, and starting as soon as possible, is so important: over a 30-year working life, the
market is almost guaranteed to rise substantially. The most
painless way to do this is with your employer's 401k or 403b
automatic payroll withdrawal plan. You can not actually invest
in the stock market as a whole, but you can invest in index mutual funds or exchange
traded funds (ETFs), which are collections of stocks that
are constructed to match or track the components of a market index. Such funds
typically have very low management fees, an important factor
in selecting an investment. Other mutual funds attempt to
"beat the market" by carefully buying and selling stocks in an
attempt to create a return that is greater than the overall
market indexes; some are temporarily successful in
doing that, but they charge higher management fees. Mutual
finds and ETFs are much less risky investments than individual
stocks. "Day traders",
investors who buy and sell stocks and other securities
multiple times over a single day, often do not perform well,
because the market is propelled in the long run by business
cycles, new businesses, and new technologies that do not
change over a single day. Minute-to-minute changes are
mostly noise.
 Some companies
periodically distribute payouts to investors called
"dividends". Those dividends are independent of the day-to-day
variations in stock price, so even if the stock value drops
temporarily, you still get the same dividend. For that reason
it's important that you set your investment account to "automatically
reinvest dividends", so when the share price drops, the
dividends are buying shares at the lower price. The S&P 500
index values used above, called price returns, did not
include dividend
reinvestment; the total returns with dividends reinvested
(https://en.wikipedia.org/wiki/S%26P_500_Index#Versions)
would have been substantially
higher, closer to 11%. (With an average total annual
return of 11%, and starting with an investment of $170 the
first month - that's less than $6 a day - and increasing it 5%
each year, you could accumulate over $600,000 over a
30 year working life, or $1,000,000 if you continued investing
an additional 5 years, as shown by the spreadsheet
graphic on the right). And that's starting at just $6 per
day, about the cost of a fancy coffee at Starbucks. Think
about that the next time you see a line of young people
waiting to order their daily coffee. The hard part is not so
much giving up the coffee as is finding a keeping a steady job
that allows you to make routine automatic contributions to
your retirement account over the long haul. Becoming a
millionaire by the time you retire is possible, but it’s not
exciting; rather, it is slow and plodding.
Some companies
periodically distribute payouts to investors called
"dividends". Those dividends are independent of the day-to-day
variations in stock price, so even if the stock value drops
temporarily, you still get the same dividend. For that reason
it's important that you set your investment account to "automatically
reinvest dividends", so when the share price drops, the
dividends are buying shares at the lower price. The S&P 500
index values used above, called price returns, did not
include dividend
reinvestment; the total returns with dividends reinvested
(https://en.wikipedia.org/wiki/S%26P_500_Index#Versions)
would have been substantially
higher, closer to 11%. (With an average total annual
return of 11%, and starting with an investment of $170 the
first month - that's less than $6 a day - and increasing it 5%
each year, you could accumulate over $600,000 over a
30 year working life, or $1,000,000 if you continued investing
an additional 5 years, as shown by the spreadsheet
graphic on the right). And that's starting at just $6 per
day, about the cost of a fancy coffee at Starbucks. Think
about that the next time you see a line of young people
waiting to order their daily coffee. The hard part is not so
much giving up the coffee as is finding a keeping a steady job
that allows you to make routine automatic contributions to
your retirement account over the long haul. Becoming a
millionaire by the time you retire is possible, but it’s not
exciting; rather, it is slow and plodding.
To illustrate how much influence stock market volatility fluctuation ("noise") has on the market gains, the Matlab/Octave script SnPsimulation.m adds proportional noise to the compound interest calculation to mimic the S&P data, performs the two curve fitting methods described above, repeats the allocations over and over with independent samples of proportional noise, and then calculates the mean and the relative standard deviation (RSD) of the rates of return. A typical result is:
TrueRateOfReturn = 0.08
Measured
Rate RSD
Coordinate transformation: 0.078
3%
Iterative curve fitting: 0.077
6%
As
you
can see, the two methods don't agree. In this example, the
return calculated by the iterative method is higher, but it could
just have easily been the other way. The fact is that the
standard deviations are fairly large, and the iterative method
always has a higher standard deviation, because it
weights the higher values more heavily, where deviations from
the line are higher, whereas the log transformation method
weights the data more evenly. Even with this uncertainty,
investing in a stock market index fund almost always performs
better in the long run than more predictable investments
such as saving accounts or CDs, which have much lower rates of
return. You can also set the "noise" (in line 5) to zero to
prove that the results would be exactly the same for both
methods, were it not for the up and down fluctuations.
In
investing in the stock market, it's important to focus on the
long-term trends and not to be frightened by the short-term up
and down fluctuations. It's similar to the difference between weather
and climate;
the large and dramatic short-term weather variations
tend to disguise the much smaller long term climate warming
that is slowly melting the icecaps and raising
the sea levels (whether it is caused by human activity or
by natural causes alone or by a combination of both). Everyone
talks about changes in the weather, but the climate changes so
slowly that it is easy to conclude that it stays the same. The
hour hand on the clock is never seen to move.
If
you are young and have many years ahead, keep your investment in
stock funds, which have the best returns. As you get older, you
can gradually shift to lower risk but lower return investments,
such as high-yield savings accounts, certificates of deposit
(CDs), money market accounts, Treasury securities and other bond
funds. Stocks perform better because they profit from new
businesses, technological advancements and improvements in
productivity.
For
a spreadsheet template that allows you to calculate the possible
returns on long-term investments in stock market mutual funds,
see https://terpconnect.umd.edu/~toh/simulations/Investment.html.